0%
Developed by autoDX · Business intelligence × Automotive distribution

One view of performance across every branch.

autoDX developed a connected reporting platform that brings sales, margin, inventory movement and order fulfilment into a shared Power BI model, replacing repeated spreadsheet consolidation with governed, role-based analytics.

Multi-branch analyticsPower BISQL + ETLERP / DMS integrationDAXRow-level security
Talk to our team→
Branch performance

One reporting model, multiple business views

01IngestBring DMS / ERP transactions and master data together.
02StandardizeAlign branch, product, customer and calendar definitions.
03ModelCreate shared measures for sales, margin, stock turn and fill rate.
04ExploreGive branch, regional and executive users governed drill-down.
4 core areassales • margin • stock • fill
1 semantic modelshared logic
Role-basedvisibility
The challenge

The data existed. A reliable cross-branch comparison did not.

Every location could report its own numbers, but management needed a consistent way to compare branches, products and customers.

Monthly reporting depended on exports, spreadsheet cleanup and analyst knowledge. Different branch codes and classifications created extra reconciliation, while follow-up questions often required another manual extraction.

Manual consolidationReports were rebuilt from multiple operational exports.
Inconsistent definitionsBranch and product mappings varied between files.
Limited drill-downStatic summaries made root-cause analysis slow.
Access complexityBranch managers and regional leaders required different data visibility.
Before autoDX

The monthly report was useful, but too much effort went into rebuilding it.

01Export

DMS and ERP reports were collected from different branches.

02Clean

Columns, codes and categories were standardized in spreadsheets.

03Reconcile

Totals and exceptions were checked manually.

04Summarize

Pivot tables and management packs were rebuilt.

05Answer follow-ups

New branch or product questions triggered another extraction.

What autoDX built

A reporting foundation that turns operational transactions into consistent management insight.

autoDX connected source data to a reusable SQL and semantic layer so Power BI reports could use the same definitions, security model and refresh process.

01

Data ingestion

Bring sales, returns, customer, product, branch, order and inventory data from DMS / ERP feeds.

02

ETL standardization

Validate records and align branch, product, customer and time dimensions.

03

Shared semantic model

Define reusable measures for sales, gross margin, stock turn and fill rate.

04

Power BI drill-down

Move from network-level performance into branch, product and customer detail.

05

Row-level security

Restrict branch-sensitive information according to user responsibility.

06

Operational monitoring

Track refresh status, rejected records, pipeline failures and data quality.

Engineering

The dashboard was only useful if every branch meant the same thing by the numbers.

01 / Technical challenge

Master data differed across branches

Branch codes, product descriptions and customer identifiers were not always aligned.

How autoDX solved itThe ETL layer standardizes identifiers and mapping rules before data enters the reporting model.
02 / Technical challenge

KPI logic had to be consistent

Spreadsheet formulas can drift between reports and analysts.

How autoDX solved itMeasures are centralized in the semantic model so the same calculation is reused across dashboards.
03 / Technical challenge

Refresh failures could quietly make reports stale

A successful visual does not guarantee fresh underlying data.

How autoDX solved itPipeline and dataset monitoring expose failed loads, rejected records and stale refreshes.
04 / Technical challenge

Security had to match the organization

Managers needed branch-level access while regional and executive users needed broader views.
How autoDX solved itPower BI row-level security maps users to authorized branches and business units.
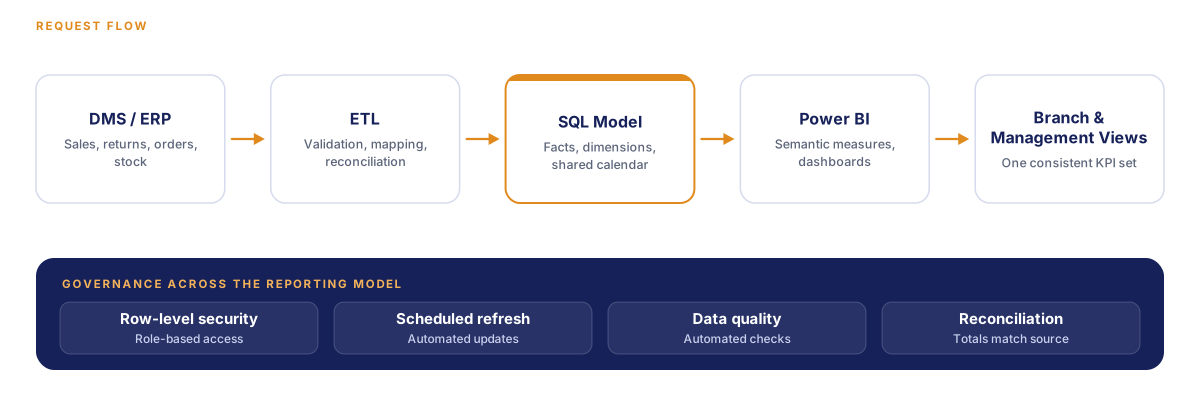
Solution architecture

Operational systems feed one governed reporting model.

Multi-Branch Reporting & Power BI architecture diagram
Swipe sideways to see the full diagram.
autoDX architecture for Multi-Branch Reporting & Power BI.
Technology

Familiar enterprise tools connected around a reusable data model.

LayerTechnologyRole
Source systemsDMS / ERP feedsProvide transactions, master data, order status and inventory.
Data ingestionETL, APIs or scheduled extractsLoad data on a repeatable schedule with validation.
Storage & transformationSQL databaseStandardize fact and dimension structures and reconciliation logic.
ReportingMicrosoft Power BI + DAXDeliver shared measures, drill-down and interactive reporting.
AccessPower BI row-level securityScope branch data to authorized users.
OperationsETL logs, refresh alerts and data-quality checksIdentify failed loads, anomalies and stale reports.
Business impact

Reporting moved from spreadsheet production to performance analysis.

Consistent branch comparisonShared measures and mappings replace workbook-specific logic.
Self-service explorationAuthorized users can filter and drill without requesting a new spreadsheet.
Less manual reportingScheduled pipelines reduce repetitive consolidation work.
Better inventory visibilityStock turn and fill-rate views connect commercial performance with availability.
Controlled accessBranch-sensitive information is governed through role-based security.
Clearer data ownershipCentral definitions and monitoring make discrepancies easier to investigate.
Next step

Turn branch reporting into a shared operating view.

autoDX connects operational data, standardizes reporting logic and gives automotive decision-makers a clearer view of sales, margin, inventory and fulfilment.